~2~Overview
~p~An industrial company relied on an aging reporting environment to monitor production and operational performance. Generating reports required manual work with a shared database, while teams at different locations needed different levels of access. The project introduced a web application designed to collect data consistently and make reporting faster and easier to manage.
~2~The Challenge
~p~The existing reporting process was too slow for regular operational decisions. Employees entered information in separate steps, analysts had to assemble reports from large datasets, and management lacked convenient access to current figures. The new system needed to work with existing enterprise software without disrupting established processes.
~2~Solution and Implementation
~3~Structured operational data collection
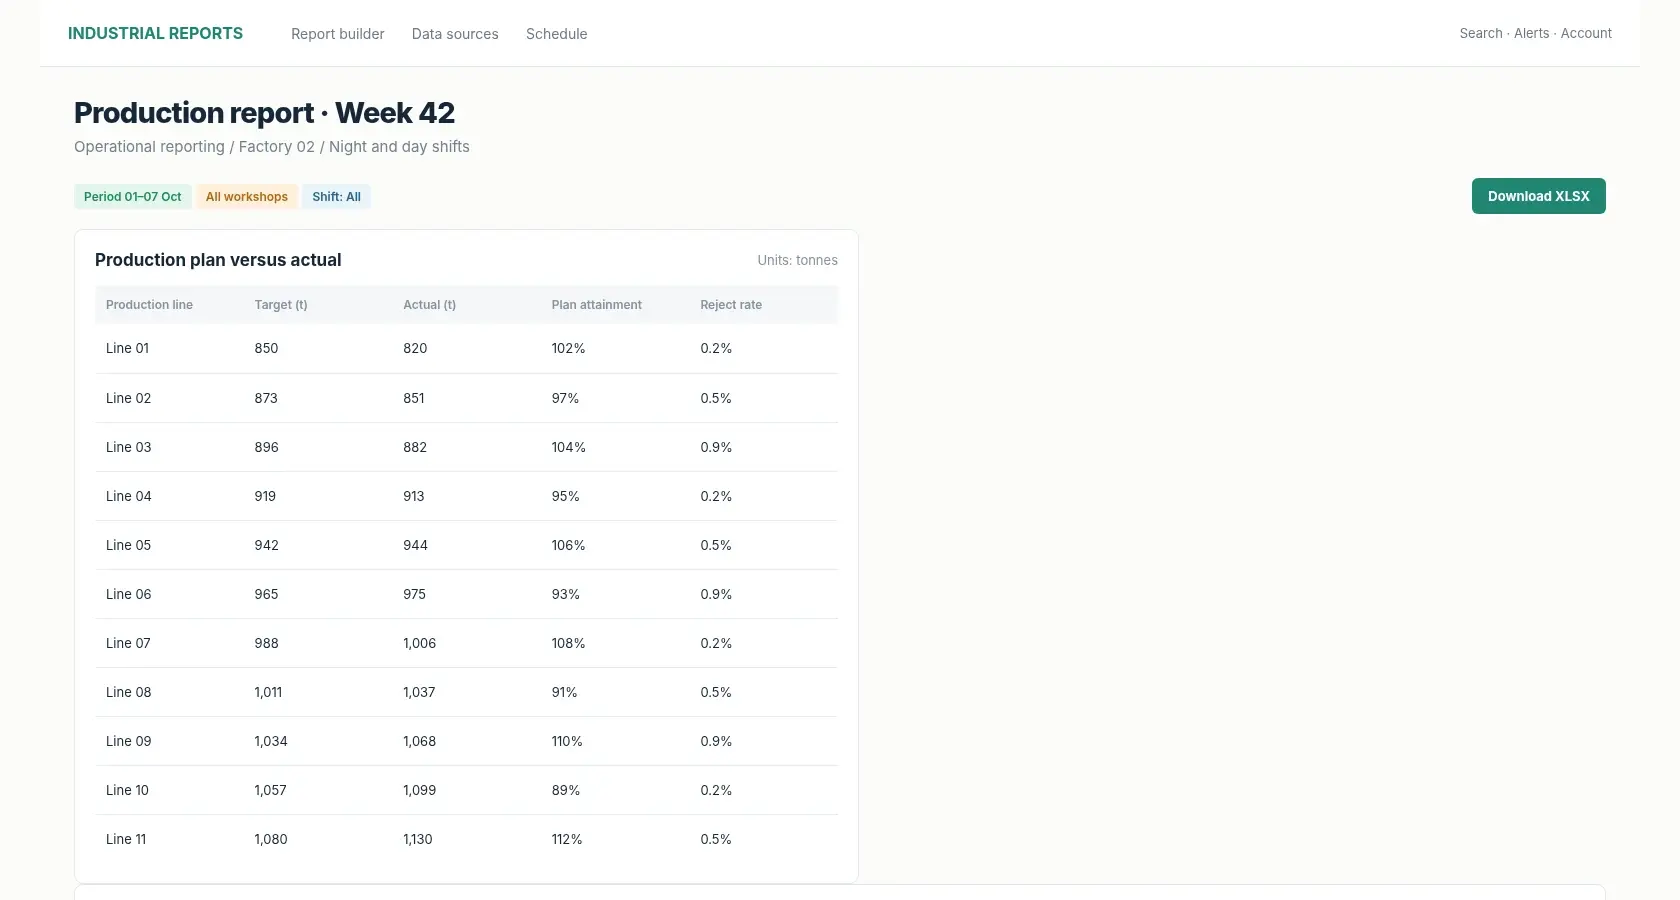
~p~The team built web-based interfaces where employees could enter shift and production information. The application consolidated these records and calculated indicators from the collected data.
~3~Dashboards for different roles
~p~Interactive charts, tables and filters provided views for operational staff and management. Permissions limited employees to the information relevant to their role or site.
~3~Reporting architecture and data migration
~p~To address slow report generation, the team reorganized reporting data and introduced a dedicated reporting layer. The old and new environments operated in parallel during the transition so reporting could continue.
~3~Configurable forms
~p~A form builder allowed authorized users to create new fields and data-entry screens without commissioning a separate feature for every reporting requirement. Validation rules helped maintain data quality.
~2~Engineering Details
~3~A reporting data mart instead of direct heavy queries
~p~Previously, analysts assembled operational reports from a shared database and waited for complex queries to finish. The solution introduced a separate reporting data mart. New production records are transformed into reporting tables, allowing common reports to query prepared data rather than repeatedly reconstruct the same calculations. During migration, both old and new database environments worked in parallel, reducing disruption to operating teams.
~3~Configurable data entry for changing operations
~p~Not every production indicator could be anticipated during design. The form builder lets authorized staff add new fields and records—for example equipment use, fuel consumption or shift activity—without commissioning a new development cycle for every field. Forms validate numeric values, dates and required fields. Permissions determine who can enter, edit or approve information.
~3~Performance testing without exposing production information
~p~The team generated about one million synthetic records for load tests. This allowed them to reproduce high-volume queries without copying commercially sensitive live operational data. Analysts can adjust report templates independently, while executives and site teams work from role-specific dashboards and the same underlying indicator definitions.
~3~Implementation specifics
~p~Shift reports were used to calculate operational indicators for extraction, material movement and processing. Interactive dashboards exposed the resulting figures according to user roles.
~p~Integration with the existing enterprise accounting environment, configurable forms and a service-oriented architecture supported gradual evolution without replacing the entire IT estate.
~2~The Outcome
~p~For the industrial operator, a report that previously took around 20 minutes could now be generated in approximately 15 seconds for simpler queries; large reports could be prepared in about one minute. Site staff gained structured data-entry screens, managers received role-specific dashboards, and analysts could adapt reports without asking developers to change the application every time. The form builder also shortened the introduction of new operational records to a matter of days.
Хотите реализовать похожий проект? Расскажите о своей задаче, и мы обсудим возможное решение